
An expert level understanding of price action and market structure will not come through books.
It comes through experience in the live markets!
It comes through direct observation!
And it comes through questioning anything new or unusual you see in the charts.
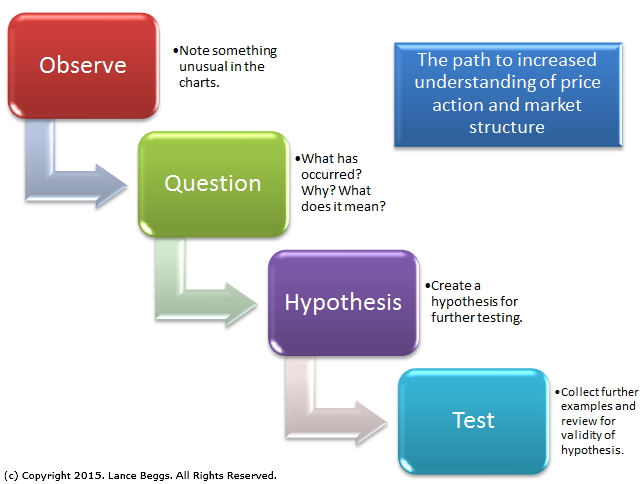
Kind of like the Scientific Method!
And exactly the process we’ve been suggesting for effective use of your Market Structure Journal.
Let’s look at a couple of examples from the last week:
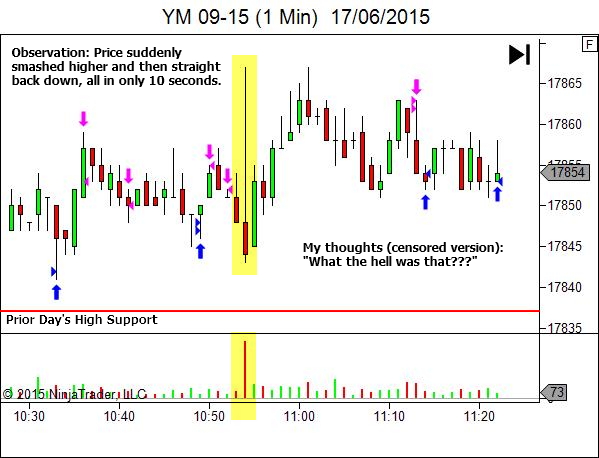
And it seems that I’m not the only one who observed this.
I guess anyone watching any of the indices would have noticed the same occurrence.
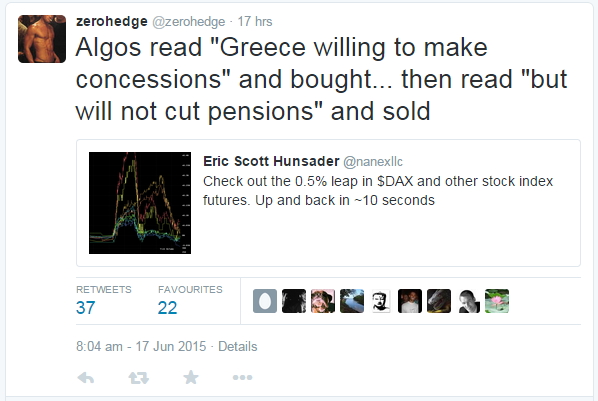
But what follows was what really caught my attention.
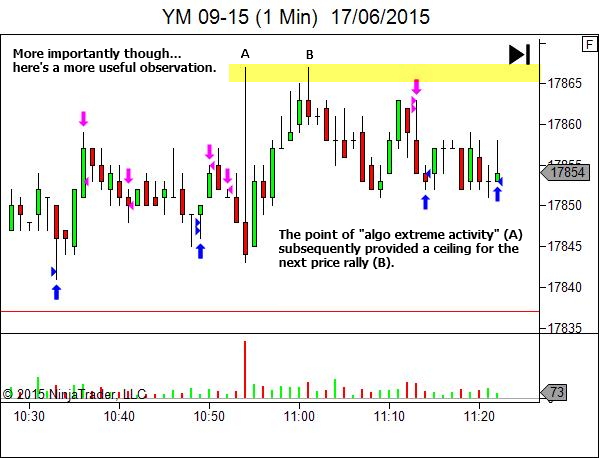
I missed the short at B because I was still freaked out about what had happened.
So let’s learn from this.
Why does the market find short-term resistance at B?
Well for the same reason that any other over-extended spike high/low offers great potential for short-term S/R. Markets are comprised of people and people have memory. This extreme becomes a new “reference point” from which people will judge value.
Standard S/R stuff.
So rather than be freaked out in future, let’s create a hypothesis:
- “The extreme point of a sudden algo driven spike has the potential to offer support or resistance should price return to the level. Watch for future trade opportunity.”
Is this valid?
I don’t know.
That’s what your Market Structure Journal is for.
Put this example in your journal. Now collect a dozen or more other examples of algo spikes, as you find them occurring in future markets. And test your hypothesis.
If you find it doesn’t hold up over time… it’s no great loss.
But if you find some value to this new “rule of thumb” then maybe, unlike me this time, you’ll be excited by an algo spike and remain focused and alert for any soon-to-follow trade opportunity.
Another example…
Let’s examine a higher timeframe structural example, to make it something different.
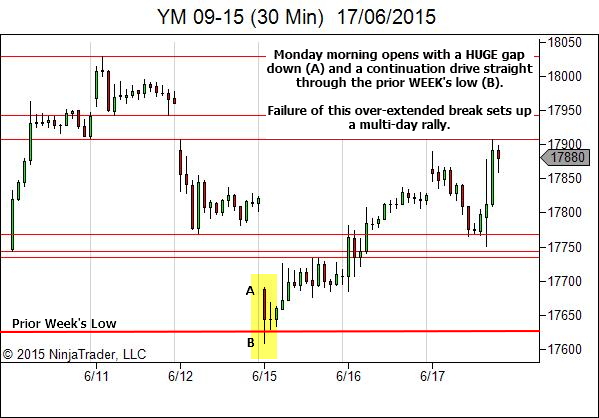
Cool.
A large gap down and continuation drive is bearish, right? Then why did it fail?
Well, clearly the only way that price can rally from here is that there was sufficient buying in order to overcome whatever selling pressure still remained after the stops were run.
So let’s set up a hypothesis.
- Watch any large Monday morning gap and immediate over-extended continuation through a significant price level. Failure to hold the break may lead to a reversal of the bias for the remainder of that session.
Will this hypothesis hold up over time?
Or does it need adjusting?
How should we define a “large” gap? How significant does the level need to be? How often does the change of bias hold for the whole remainder of that session? How often does the change of bias extend through to following sessions?
If these questions interest you, place this example in your Market Structure Journal.
Collect more occurrences. Study them. And test the hypothesis.
Ok… now it’s your turn. Any new observations you make that interest you… FOLLOW THE SAME PROCESS.
I know I haven’t provided answers. But this is the best way to learn.
Get stuck into the charts and study them.
No matter your market.
No matter your timeframe.
Observe -> Question -> Hypothesis -> Test
It’s the path to increased understanding of Price Action and Market Structure.
Happy trading,
Lance Beggs