
For the last seven years I’ve been highly recommending traders keep a Market Structure Journal for recording and studying any interesting market structure and price action observations.
In my opinion this will become the greatest book in your trading library, by a long margin. Certainly the most valuable in terms of quality content.
Every day… find something of interest in the charts. Print it out, study it and add notes. File it in your journal. And review it often.
Usually traders will produce their journal in one of two ways.
(1) Based upon themes. Choose a theme for the current month, such as: “This month I will study the price action which forms the low of the day for clues that may have alerted me to this being a significant low.” Then next month, replace it with another theme.
(2) Completely freeform. Simply focus on whatever stands out the most from the current session. For example, “Today’s climactic exhaustion into prior resistance is amazing. Let’s study that; and in particular that opportunity to fade the move on the weaker retest of the highs”.
Today’s article fits more in the “completely freeform” category in that it’s based upon something that stood out in the markets.
But with a slight twist.
Instead of focusing on the feature of interest (a monster trend day), I thought it would be a good idea to look at what follows it (the day after a monster trend day).
While there is value in studying a price action sequence which stood out during a session, there is also exceptional value in studying what comes after it.
One example (such as provided here) cannot give a complete and accurate picture about “how to trade the day after a monster trend day”. At best, it may provide us with a hypothesis which can be explored as further examples are found in future trading sessions. Over time our Market Structure Journal will be populated by other similar occurrences. And as we get 20+ examples of “day after monster trend day” we’ll start to see some common features that allow us to establish some “rules of thumb” for extracting profits from these days.
Last Friday’s Crude Oil session provided a monster trend day.
Let’s start by looking at the daily and 30 minute charts to get an idea of what happened that day.
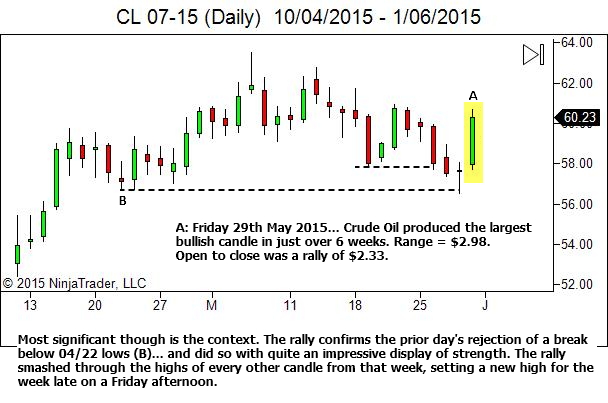
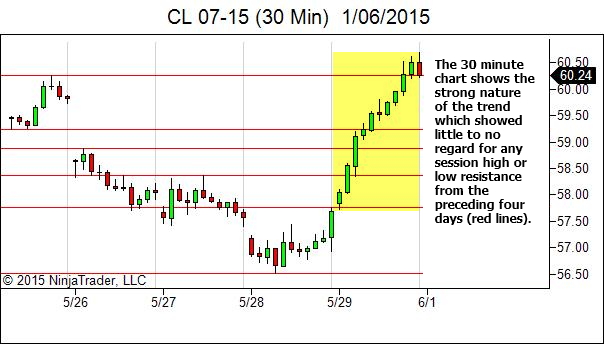
Certainly this day was worthy of it’s own journal entry.
But let’s check out what followed. Because while we might not be able to recognise a monster trend till part-way through the session, we will always know when we’re about to commence trading a “day after monster trend day”.
So it will be very handy to have some “rules of thumb” in place for what to expect following a monster trend day, if that is at all possible.
Let’s examine this one occurrence, from Monday 1st June, and see if we can find anything interesting.
We’ll use a combination of both 30 and 5 min charts, simply because they fit the required data into my article image sizes. In producing your own journal entries you will typically use your higher timeframe (or higher) for structural analysis and the trading timeframe for price action analysis.
Let’s look first to see what immediately followed the monster trend day. Did it produce any significant follow-through in the overnight data?
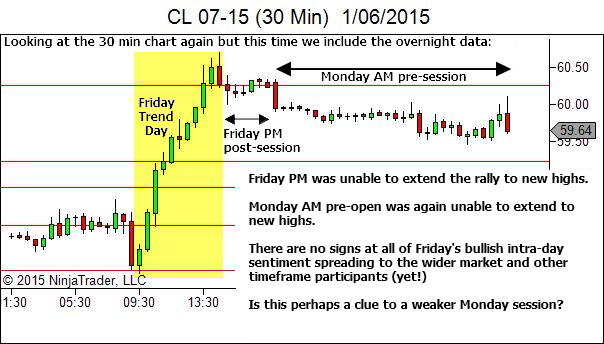
The overnight data showed no continuation of Friday’s bullish sentiment. So let’s look now to the 5 minute chart to see where Monday opens within Friday’s range… and where that is with respect to key structural areas.
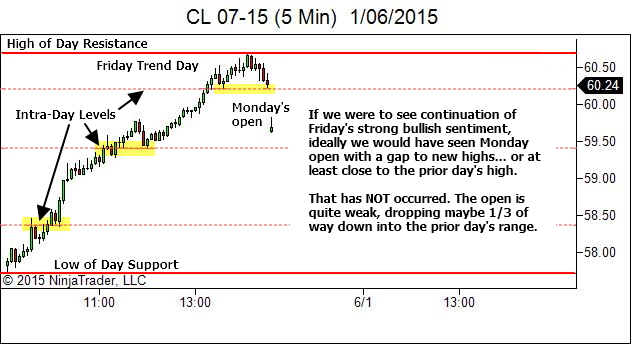
What does this weak open mean from the perspective of other traders? Let’s put ourselves in the mindset of anyone caught up in the excitement of Friday’s trend, and entering the market LONG.
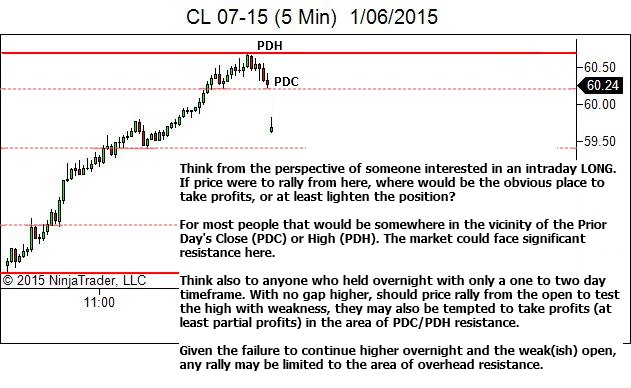
Ok… weak overnight data and a weak open. Let’s see how the session now plays out, first with regards to any attempts to breach the resistance level.
And then finally for the whole session.
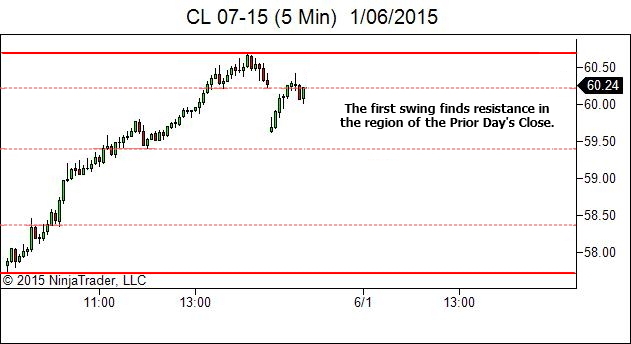
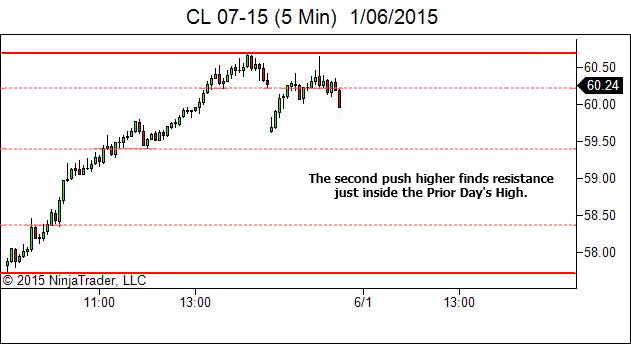
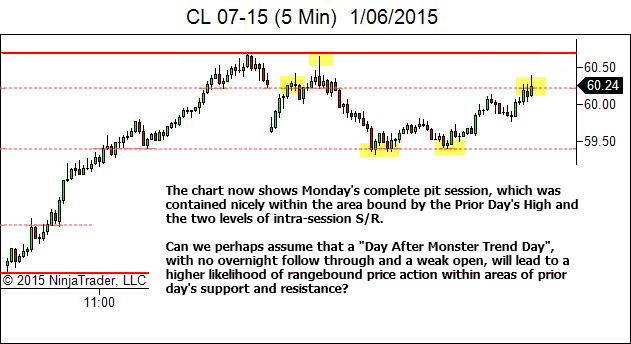
One observation is of course insufficient to make this claim.
But this is a great example of how we use the Market Structure Journal to study the structure and price action and develop useful rules of thumb for how to read and trade the markets. The first example has led to an observation and a hypothesis. Now… find another 20 or so examples and see if you can confirm or rule out the hypothesis, or perhaps identify some other completely different characteristics and another useable rule of thumb.
Hypothesis: A Day After a Monster Trend Day, which shows no follow through overnight and a weak open, is likely to remain rangebound within prior session S/R levels.
If our hypothesis proves correct then these days may well give us good levels to trade off.
Now… it’s your turn… print this article, or make some summary notes, and place it in your Market Structure Journal. And then find another 20 or so examples in coming months. Let me know what you find.
Best of luck,
Lance Beggs